
I have an APC UPS which I like to monitor, and graph, this is the code I use to do so.
So I created a bash script to monitor and graph the state of my UPS.
Firstly run this script with the “create” parameter ups.sh create then create a cron job to regularly update:
* * * * * root /usr/local/bin/ups.sh update > /dev/null && /usr/local/bin/ups.sh graph > /dev/null
This script requires rrdtool to be installed.
#!/bin/bash
TRAF=/var/www/html
UPS=192.168.1.98
case $1 in (create)
/usr/bin/rrdtool create $TRAF/ups.rrd -s 60 \
DS:upsBat:GAUGE:600:0:U \
DS:upsLoad:GAUGE:600:0:U \
DS:upsBatRun:GAUGE:600:0:U \
RRA:AVERAGE:0.5:1:4320 \
RRA:AVERAGE:0.5:1440:3 \
RRA:MIN:0.5:1440:3 \
RRA:MAX:0.5:1440:3;;
(update)
upsBat=`snmpget -v1 -c public $UPS 1.3.6.1.4.1.318.1.1.1.2.2.1.0 | awk '{ print $4 }'`
upsLoad=`snmpget -v1 -c public $UPS 1.3.6.1.4.1.318.1.1.1.2.2.8.0 | awk '{ print $4 }'`
upsBatRun=`expr \`snmpget -v1 -c public $UPS .1.3.6.1.4.1.318.1.1.1.2.2.3.0 | awk '{ print $4 }' | sed 's/\((\|)\)//g'\` / 6000`
/usr/bin/rrdtool update $TRAF/ups.rrd N:$upsBat:$upsLoad:$upsBatRun;;
(graph)
/usr/bin/rrdtool graph $TRAF/ups.png \
--start "-3day" \
-c "BACK#000000" \
-c "SHADEA#000000" \
-c "SHADEB#000000" \
-c "FONT#DDDDDD" \
-c "CANVAS#202020" \
-c "GRID#666666" \
-c "MGRID#AAAAAA" \
-c "FRAME#202020" \
-c "ARROW#FFFFFF" \
-u 1.1 -l 0 -v "UPS" -w 1100 -h 250 -t "UPS - `/bin/date +%A", "%d" "%B" "%Y`" \
DEF:upsBatA=$TRAF/ups.rrd:upsBat:AVERAGE \
DEF:upsLoad=$TRAF/ups.rrd:upsLoad:AVERAGE \
DEF:upsBatRun=$TRAF/ups.rrd:upsBatRun:AVERAGE \
"CDEF:upsBat=upsBatA,1,*" \
AREA:upsBatRun\#00FF00:"Battery Runtime (Mins)" \
GPRINT:upsBatRun:MIN:"Min\: %3.2lf " \
GPRINT:upsBatRun:MAX:"Max\: %3.2lf" \
GPRINT:upsBatRun:LAST:"Current\: %3.2lf\j" \
COMMENT:"\\n" \
AREA:upsBat\#FFFF00:"Battery Percent" \
GPRINT:upsBat:MIN:"Min\: %3.2lf " \
GPRINT:upsBat:MAX:"Max\: %3.2lf" \
GPRINT:upsBat:LAST:"Current\: %3.2lf\j" \
COMMENT:"\\n" \
AREA:upsLoad\#FF0000:"UPS Load (volts)" \
GPRINT:upsLoad:MIN:"Min\: %3.2lf " \
GPRINT:upsLoad:MAX:"Max\: %3.2lf" \
GPRINT:upsLoad:LAST:"Current\: %3.2lf\j";;
(*)
echo "Invalid option.";;
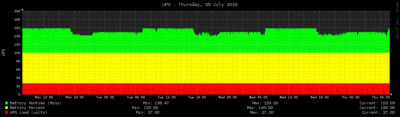
esacThe resulting graph looks like this:
Leave a Comment
Liked what you've read?
It only takes a second of your time, but it means the world to me.
Don't comment on Facebook, comment here !
I don't keep any of your information, I only ask for a name, and an email to stop spammers!
Pretty please !! :)